

By David Rogers. BLOWING ROCK, N.C. — Hope springs eternal. The U.S. equity markets continue to be buoyed by hopeful tweets that the war in Iran is coming to an end, the Strait of Hormuz is opening back up and that Iran will forfeit its ambitions for developing a nuclear weapon. One can only wish that the Trump administration will find a way to extricate themselves — and us — before gasoline in the U.S. reaches $10 per barrel nationwide and many of the world economies are rendered bankrupt.
Politics and policy pursuits aside, this is a fascinating stock market environment. With its breakout above well-defined horizontal resistance at 697 in mid-April, the more technology driven Standard & Poor’s 500 established an intermediate-term upside target in our system of timing signals of a fairly wide target range: 724-801. Obviously, the lower end of that target range was met last week and the S&P has continued its push higher.
Meanwhile, the Dow Jones Industrial Average has only kinda-sorta followed suit. In truth, it has stalled near the February highs and struggled in encountering the upper band of our Dynamic Trading Channel with substantial breadth deterioration. In short, market prices are being pushed higher by fewer and fewer stocks. To explain the diverging patterns of the S&P 500 and the Dow Industrials, we could speculate that the price of oil is more onerous to the income statements of the larger, more mature companies and the market may be pricing that in.
We have previously explained our rationale for an earlier, LONG-TERM target for the DJIA to reach 100,000 in the next 10-15 years (assuming the world has not blown itself up at the hands of ill-suited “leaders”). But between current market levels and that loftier target there are bound to be INTERMEDIATE-TERM corrections. Those materialize as some combination of adverse price declines or extensive sideways consolidation.

April 23, 2026 MarketView: /marketview-april-23-2026/
Given that we are already reaching into our target range for the S&P 500 and the Dow Industrials are looking tired, I prefer to fully hedge my long-term equity portfolios.
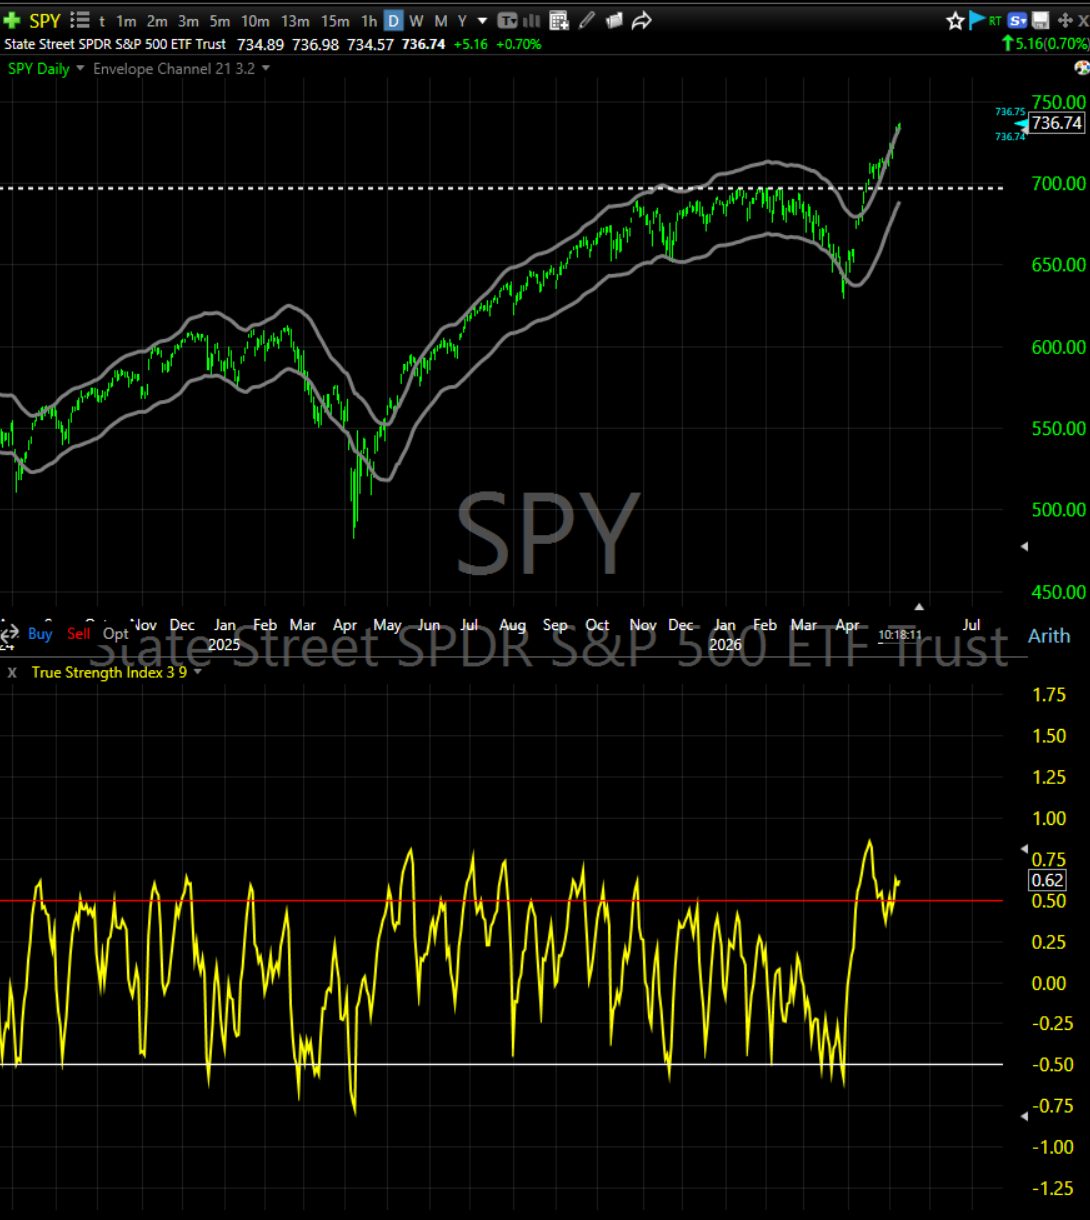
In the graph below, see how the S&P 500 pattern looks distinctively different than the pattern for the Dow Industrials ETF above.
DISCLAIMER: The information provided in this publication is for informational and educational purposes only and does not constitute investment advice, financial advice, or a recommendation to buy or sell any securities. The opinions expressed are those of the authors and are subject to change without notice. Investing in the stock market involves risk, including the possible loss of principal. Past performance is not indicative of future results. Readers should conduct their own research and consult with a qualified financial advisor before making any investment decisions. This publication and its contributors may hold positions in the securities mentioned and may buy or sell such securities without notice.

